
This Week in Crypto (Mar, 1, 2026)

Market Overview
Macro
The macro backdrop has shifted decisively into a risk-off configuration that is structurally unfavorable for crypto in the near term. The 10-year Treasury yield fell to 4.02% in late February, its lowest level since November 2025, dropping 22.6 basis points over four weeks — but critically, this compression is driven by safe-haven flows rather than growth optimism. The move below 4% came specifically on stagflation risk as producer prices heated up, creating the worst possible environment for duration assets like crypto: sticky inflation preventing Fed easing while growth concerns trigger defensive positioning. Gold hit an all-time high of $5,595 on January 29, 2026, and is currently trading at $5,278, up 81% year-over-year, with JPMorgan raising its year-end 2026 target to $6,300. When gold is printing ATHs alongside VIX at 19.85 (up 6.61% in 24 hours) and rate cut expectations pushed out to July, capital is fleeing to safety, not rotating into speculative beta. The real alarm: margin debt growth in December 2025 exceeded the 12-month S&P 500 return — a divergence that has only occurred three times in market history, each preceding a major equity bear market.
For crypto specifically, this regime creates a high bar for sustained upside. Bitcoin is trading around $66K, down from highs, caught between geopolitical chaos (US-Iran strikes drove WTI oil volatility to 68% before settling at 51%) and a Fed that won’t pivot until inflation convincingly breaks. The one constructive signal is the dollar weakening to 97.65 (down 0.23%), which historically supports crypto, but this is being overwhelmed by broader risk-off flows. Until yields stop falling on fear and start rising on growth, or until the Fed actually begins cutting in July, the next 1–3 months are more likely to favor consolidation and defensive positioning rather than a leverage-fueled breakout. BTC can grind as a macro hedge alongside gold, but expecting ETH or alts to rip in an environment where professional investors are reducing equity exposure and piling into Treasuries is fighting the tape.
Crypto Market Summary
BTC Price Action: BTC is trading around $67,997 (3.18% 24h, -0.85% 7d).
BTC/ETH Dominance: BTC is at 58% and ETH is at 10.5%. BTC dominance is down while ETH dominance is up this week.
ETF Flows: ETFs saw net inflows after a weekly higher low of net inflows, with net inflows of $784M into BTC, $80.5M into ETH, and $44.5M into SOL.
Social/Search Trends: Interest in “Bitcoin” and “crypto” is near the bottom of its 12-month range, and has ticked up a bit.
Fear & Greed Index: Currently at 16 (“Extreme Fear”), up 2 points over the past week, indicating a mild continuation in sentiment recovery.
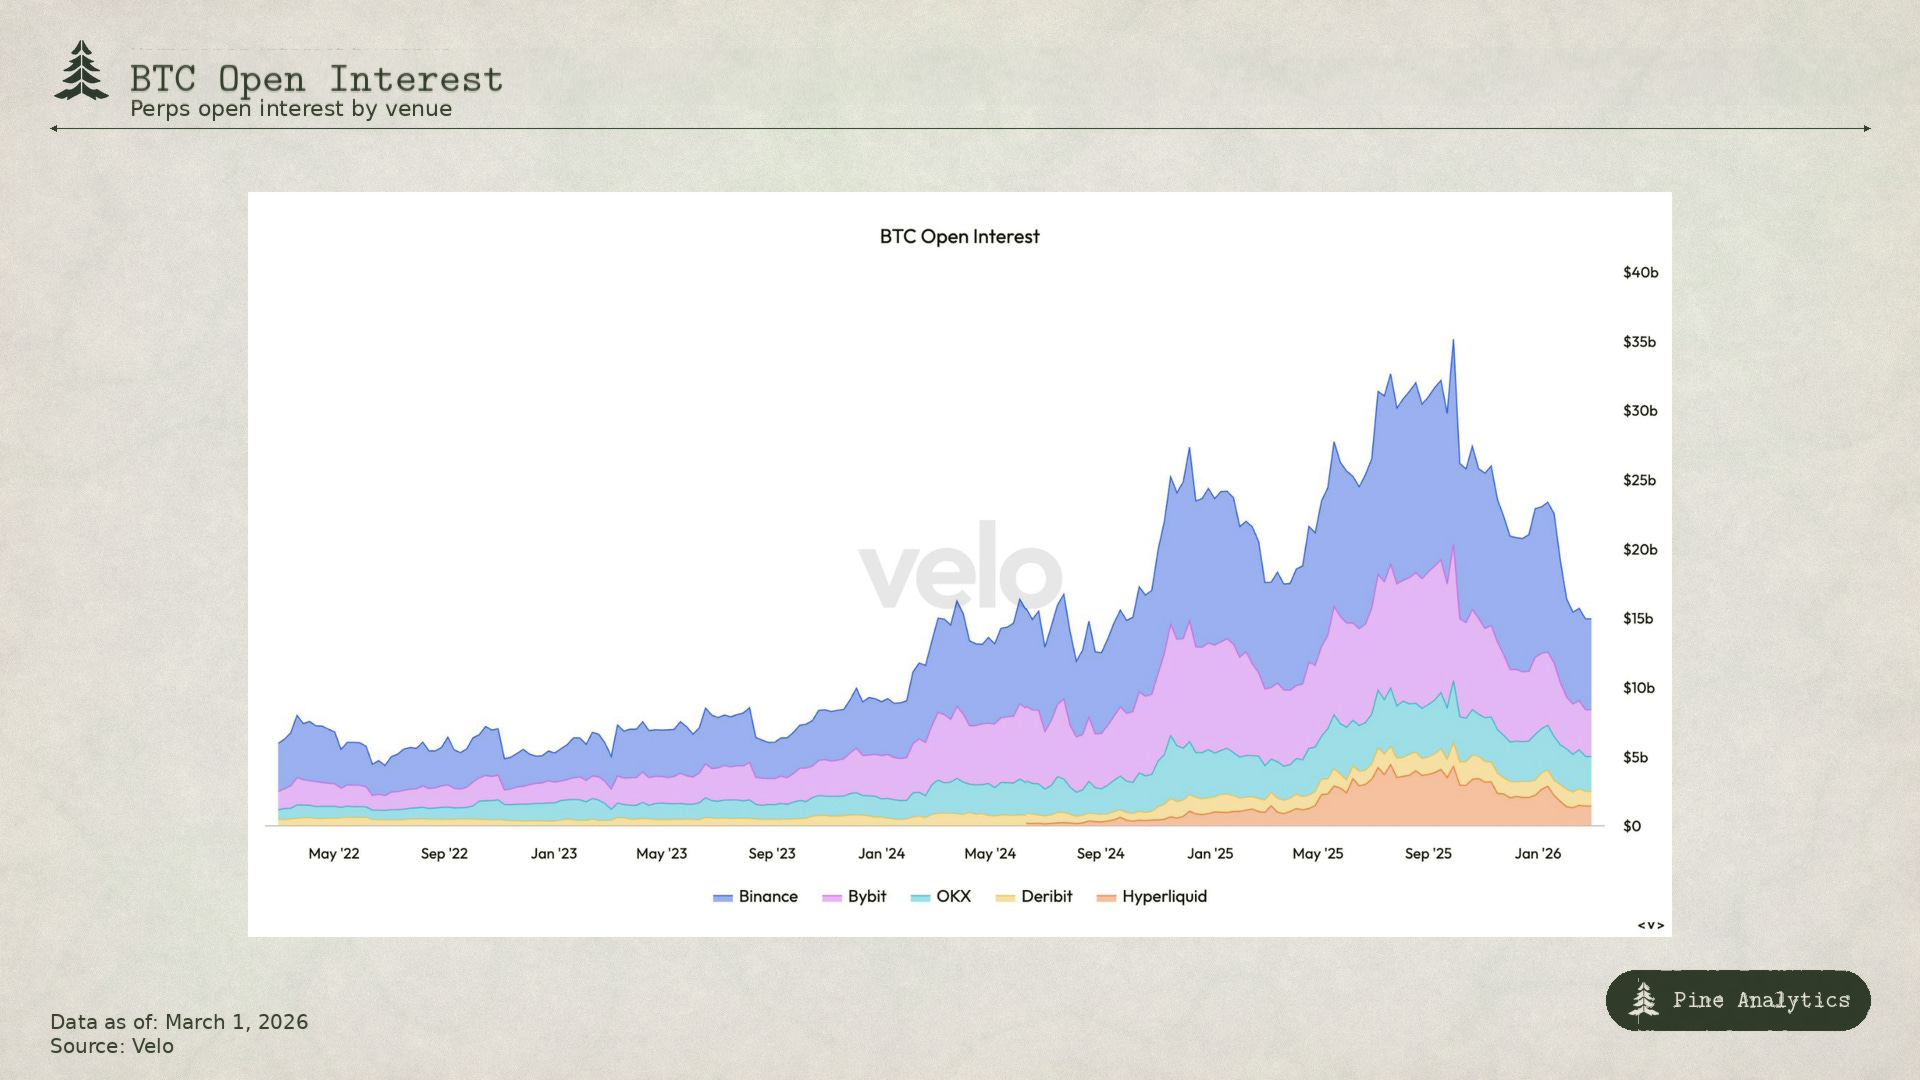
BTC Open interest: Currently, the perps open interest on the top 5 venues is $15.08B and this is down $520M from the beginning of the week.
BTC 3 Month Annualized Basis: Currently, the 3-month annualized basis of BTC is 2.4%, down from 3.38% one week ago.
Interpretations and Future Outlook
The on-chain and market structure data paint a picture of capitulation-in-progress rather than conviction. The collapse in 3-month annualized basis from 3.38% to 2.4% signals that leveraged longs are getting flushed, while the $520M decline in perpetual open interest confirms deleveraging is underway. This is textbook fear-driven liquidation: participants are either closing positions or getting stopped out, not adding risk. Combined with Fear & Greed at 16 (Extreme Fear) and social interest scraping multi-month lows, retail has checked out entirely. The one stabilizing force is institutional spot demand — $784M in BTC ETF inflows and rising ETH dominance suggest that while leverage is being wrung out, patient capital continues to accumulate at these levels. This creates a setup where downside is increasingly limited by spot bids, but upside remains capped until macro conditions shift or sentiment exhausts to the downside.
The next 2-4 weeks are likely to be characterized by choppy, range-bound price action as the market digests whether the current Fear & Greed reading marks a local bottom or precedes a final capitulation leg. A sustained move above $70K would require either a meaningful shift in macro (yields reversing higher on growth, Fed signaling sooner cuts, or geopolitical tensions easing) or a technical squeeze driven by basis normalization and short covering. Conversely, a break below $64K would likely trigger another round of liquidations and test whether spot ETF demand can absorb the selling. For now, the risk/reward favors patience: the data suggests we’re closer to a bottom than a top, but without a macro catalyst or sentiment washout, explosive upside remains unlikely in the immediate term.
Stablecoin Metrics
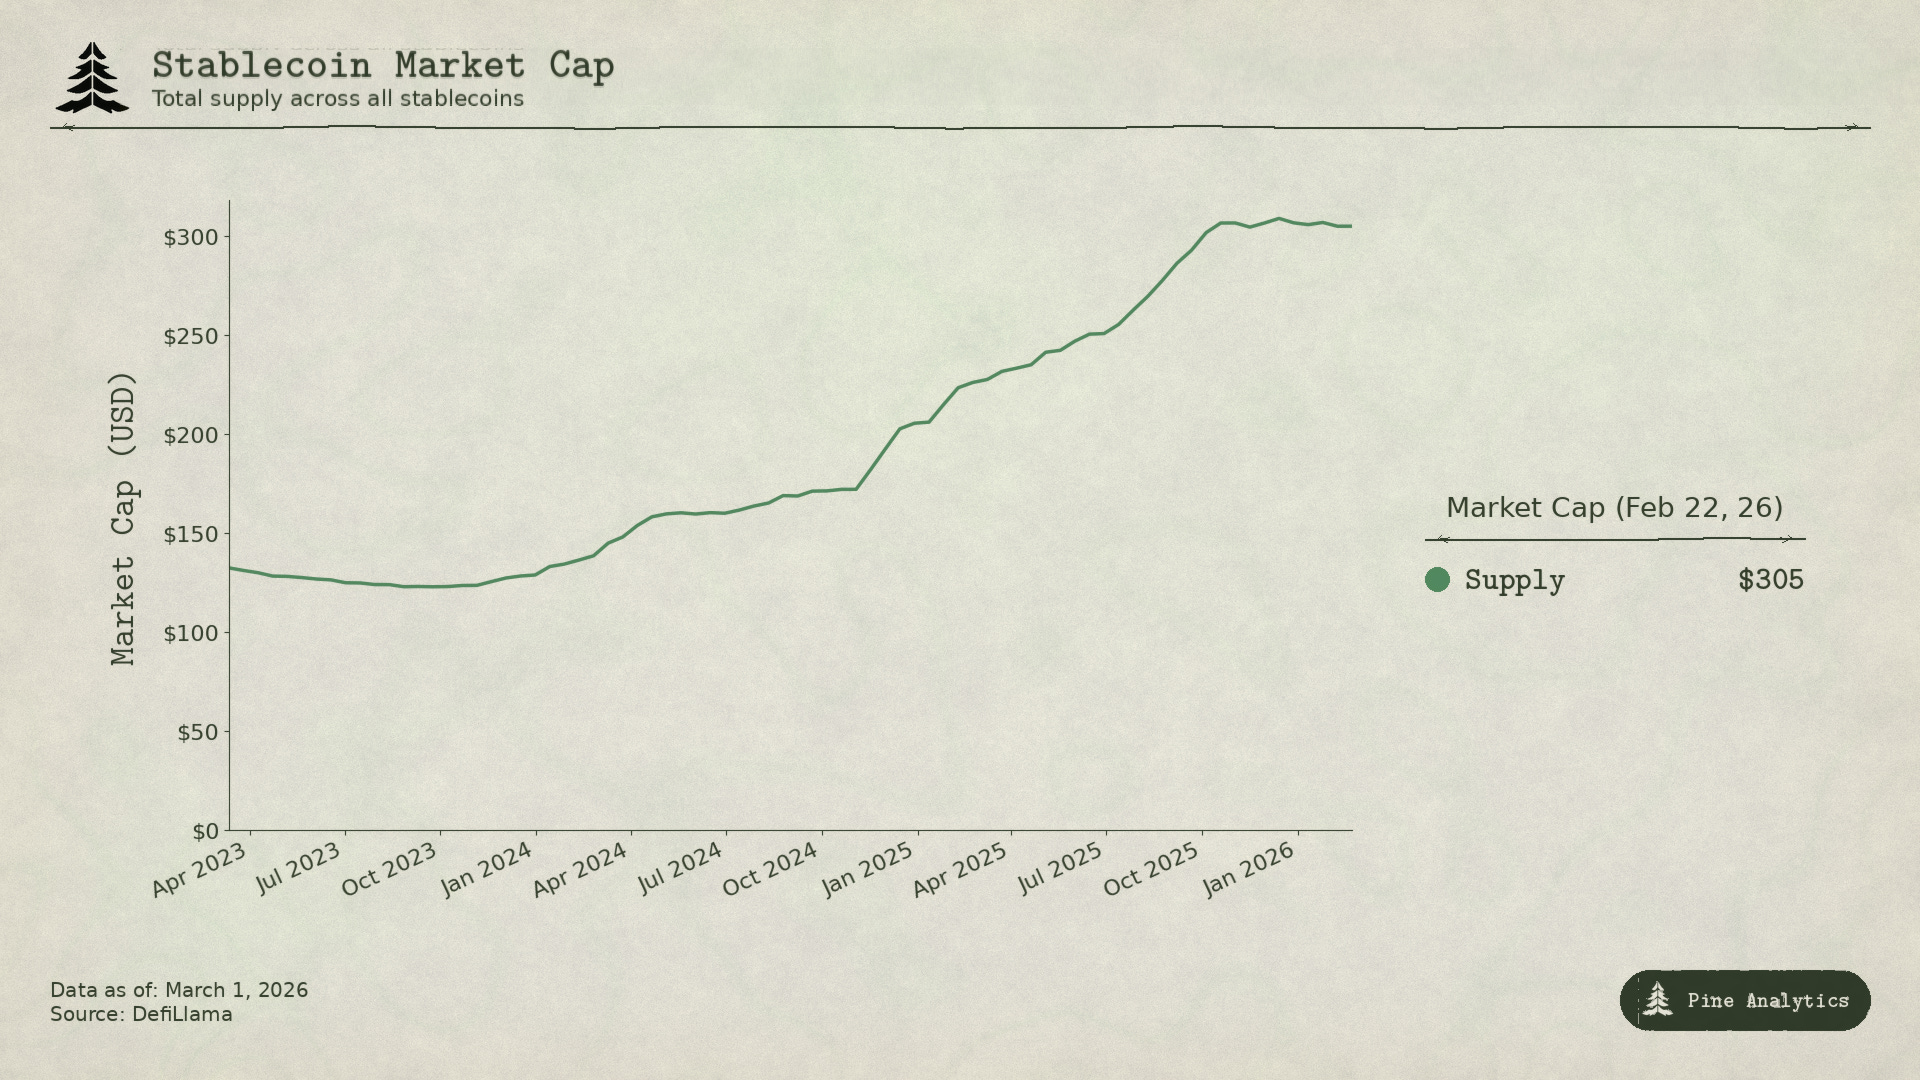
Market Capitalization: Stablecoin market cap stands at $305.8B, with supply up $2.4B week-over-week and $2B over the past 30 days. Stablecoin supply appears to be stalling after running up through mid-October.
Stablecoin Supply Rates:
• AAVE: 1.94%–1.99%
• Kamino: 1%–1.6%
• Save Finance: 2.76%-2.99%
• JustLend: 1.98%–3.45% (4.98% for USDD)
• Spark.fi: 4%
Chain-Specific Changes: Supply expanded on plasma, Ethereum, and BNB, while Tron and Ripple saw net supply contraction.
Token-Specific Changes: USDC, USDT and USCY experienced inflows, while M and USD1 saw declines.
Interpretation and Outlook: Stablecoin supply dynamics signal a market in equilibrium rather than expansion mode. At $305.8B total market cap with modest $2B monthly growth, the deceleration from the mid-October surge indicates capital formation has stalled. More critically, supply rates across major platforms — AAVE at sub-2%, Kamino at 1-1.6%, Spark at 4% — offer minimal incentive for holders to keep stables parked on-chain when risk-free Treasuries yield more. This suggests current stablecoin balances represent maintenance liquidity and exchange float rather than aggressive dry powder waiting to deploy. The token-level shifts are more instructive: USDC and USDT inflows indicate institutional and exchange liquidity building, while USCY inflows (yield-bearing) show sophisticated capital seeking carry while maintaining optionality. For stablecoin supply to signal an impending alt season, monthly growth needs to re-accelerate above $5B+ rather than the current $2B trend. Until then, existing supply provides support for spot bids but lacks the magnitude to fuel a broad-based leverage-driven rally across the risk curve.
On-Chain Economy Snapshot
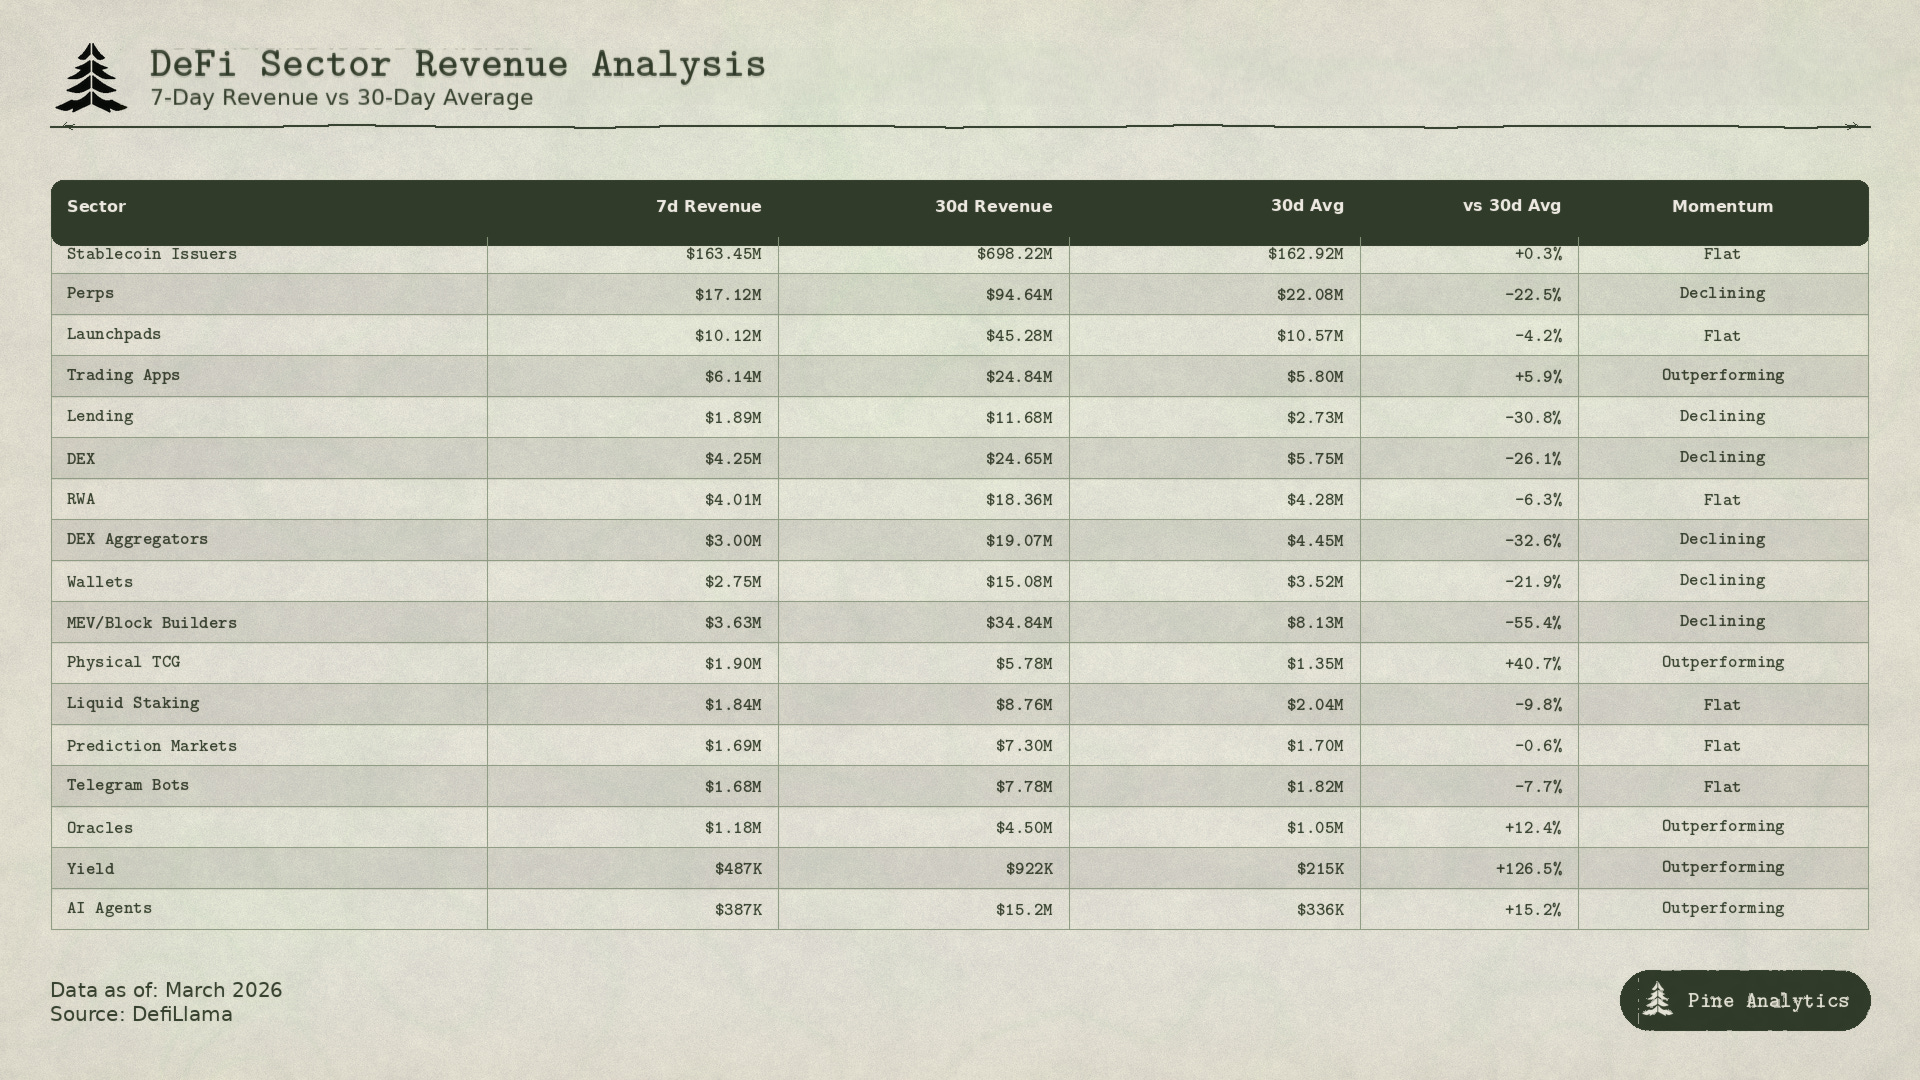
To measure real activity across the crypto economy, we track protocol revenue — fees paid by users to interact with applications. The table above samples the top 50 protocols by trailing 7-day revenue, aggregated by sector, and compares current weekly revenue to the 30-day weekly average to identify momentum.
The data confirms broad-based decline across core trading infrastructure. Perps generated $17M in fees this week, down 23% from the trailing average. DEXs are down 26%, aggregators down 33%, wallets down 22%. The pattern is consistent: fewer users, fewer swaps, less leverage. MEV and block builder revenue compressing over 50% is particularly notable — when there’s less profit to extract from transactions, speculative activity is drying up at the source.
Against this declining breadth, a handful of sectors show relative strength. Trading apps ($6.1M, +6%) are the standout — tools like AntFun and Axiom Pro are gaining share even as overall volume declines, suggesting active traders are consolidating into specialized interfaces rather than exiting entirely. Yield protocols surged 127% as sophisticated capital seeks carry while waiting for direction. Oracles (+12%) and AI Agents (+15%) continue grinding higher on stickier demand, though from smaller bases.
Stablecoin issuer revenue remains flat at $163M — mostly a function of supply times interest rates rather than new capital entering. Lending protocols pulled in just $1.9M, down 31%, reflecting reduced borrowing demand in a risk-off environment. Prediction markets held steady, while launchpad revenue ($10M) stayed flat despite the broader contraction.
The read: core trading infrastructure revenue is declining, meaning on-chain capital is less active. The sectors holding up serve either niche use cases with real retention or sophisticated users optimizing yield while they wait. This is consistent with consolidation rather than capitulation — activity is compressing, not collapsing. A reversal in DEX and perps revenue would be the first signal that risk appetite is returning.
Conclusion
The crypto market is in a defensive posture. Macro conditions remain unfavorable — yields falling on fear rather than growth, gold at all-time highs, and rate cuts pushed to July create a high bar for sustained upside. On-chain, the picture confirms what price action suggests: deleveraging is underway, retail has exited, and activity is compressing across core infrastructure. This is consolidation, not capitulation — but it’s also not the setup for a leverage-fueled breakout.
The stabilizing forces are real. Institutional spot demand continues ($784M in BTC ETF inflows), stablecoin supply is holding at $306B, and the sectors showing relative strength — trading apps, yield protocols, oracles — suggest sophisticated capital is still engaged, just defensive. The floor is firming, but the ceiling remains capped.
For the next 2-4 weeks, expect choppy, range-bound price action. BTC likely trades between $64K and $70K unless a catalyst shifts the regime. A break above $70K requires either macro relief (Fed signaling earlier cuts, yields rising on growth) or a technical squeeze as basis normalizes and shorts cover. A break below $64K triggers another liquidation wave and tests whether spot ETF demand can absorb the selling.
Key variables to watch:
BTC $64K / $70K — defines the range; breaks either way signal next leg
3M basis — currently 2.4%; sub-2% signals full capitulation, above 4% signals leverage returning
DEX and perps revenue — reversal here is the first sign risk appetite is back
Fed expectations — any pull-forward of July cut would be bullish; push-back extends the chop
Fear & Greed — at 16 (Extreme Fear); sub-10 would mark a generational buying opportunity
The data says we’re closer to a bottom than a top — but without a catalyst, patience is the right positioning.