
Tracking bSOL: Adoption, Usage, and Ecosystem


Submission: Liquid Staking Data Track – SolBlaze bSOL Ecosystem Dashboards
This submission includes a set of original dashboards designed to give a clear, data-driven view of the bSOL ecosystem—focusing on usage patterns, DeFi integrations, and user-level activity. Built using Flipside’s query infrastructure, the dashboards surface key insights into how bSOL is circulating, accumulating value, and being utilized across Solana.
The submission consists of three parts:
A bSOL ecosystem dashboard covering supply trends, holder distribution, DeFi deployments, and DEX-level activity.
A wallet-level tracker that allows users to look up their personal bSOL balances, rewards earned, and transaction history.
A cross-token Solana LST dashboard that compares bSOL with other LSTs on metrics like TVL, holder growth, and adoption shifts.
Together, these tools provide a comprehensive overview of bSOL’s growth and footprint, aligning closely with the goals of the Liquid Staking Data track by emphasizing transparency, comparative insights, and user accessibility.
bSOL Analytics Dashboard Overview
https://flipsidecrypto.xyz/pine/bsol-metrics-E0LubM
This dashboard provides a comprehensive view of the bSOL ecosystem across market activity, holder distribution, DeFi integrations, and protocol-specific behavior. Built using Flipside’s real-time query engine, it includes:
Market Metrics: Tracks weekly market cap, net supply, and token holder growth for bSOL.
Holder Insights: Shows balance distribution across wallets, including top holders and whale concentration.
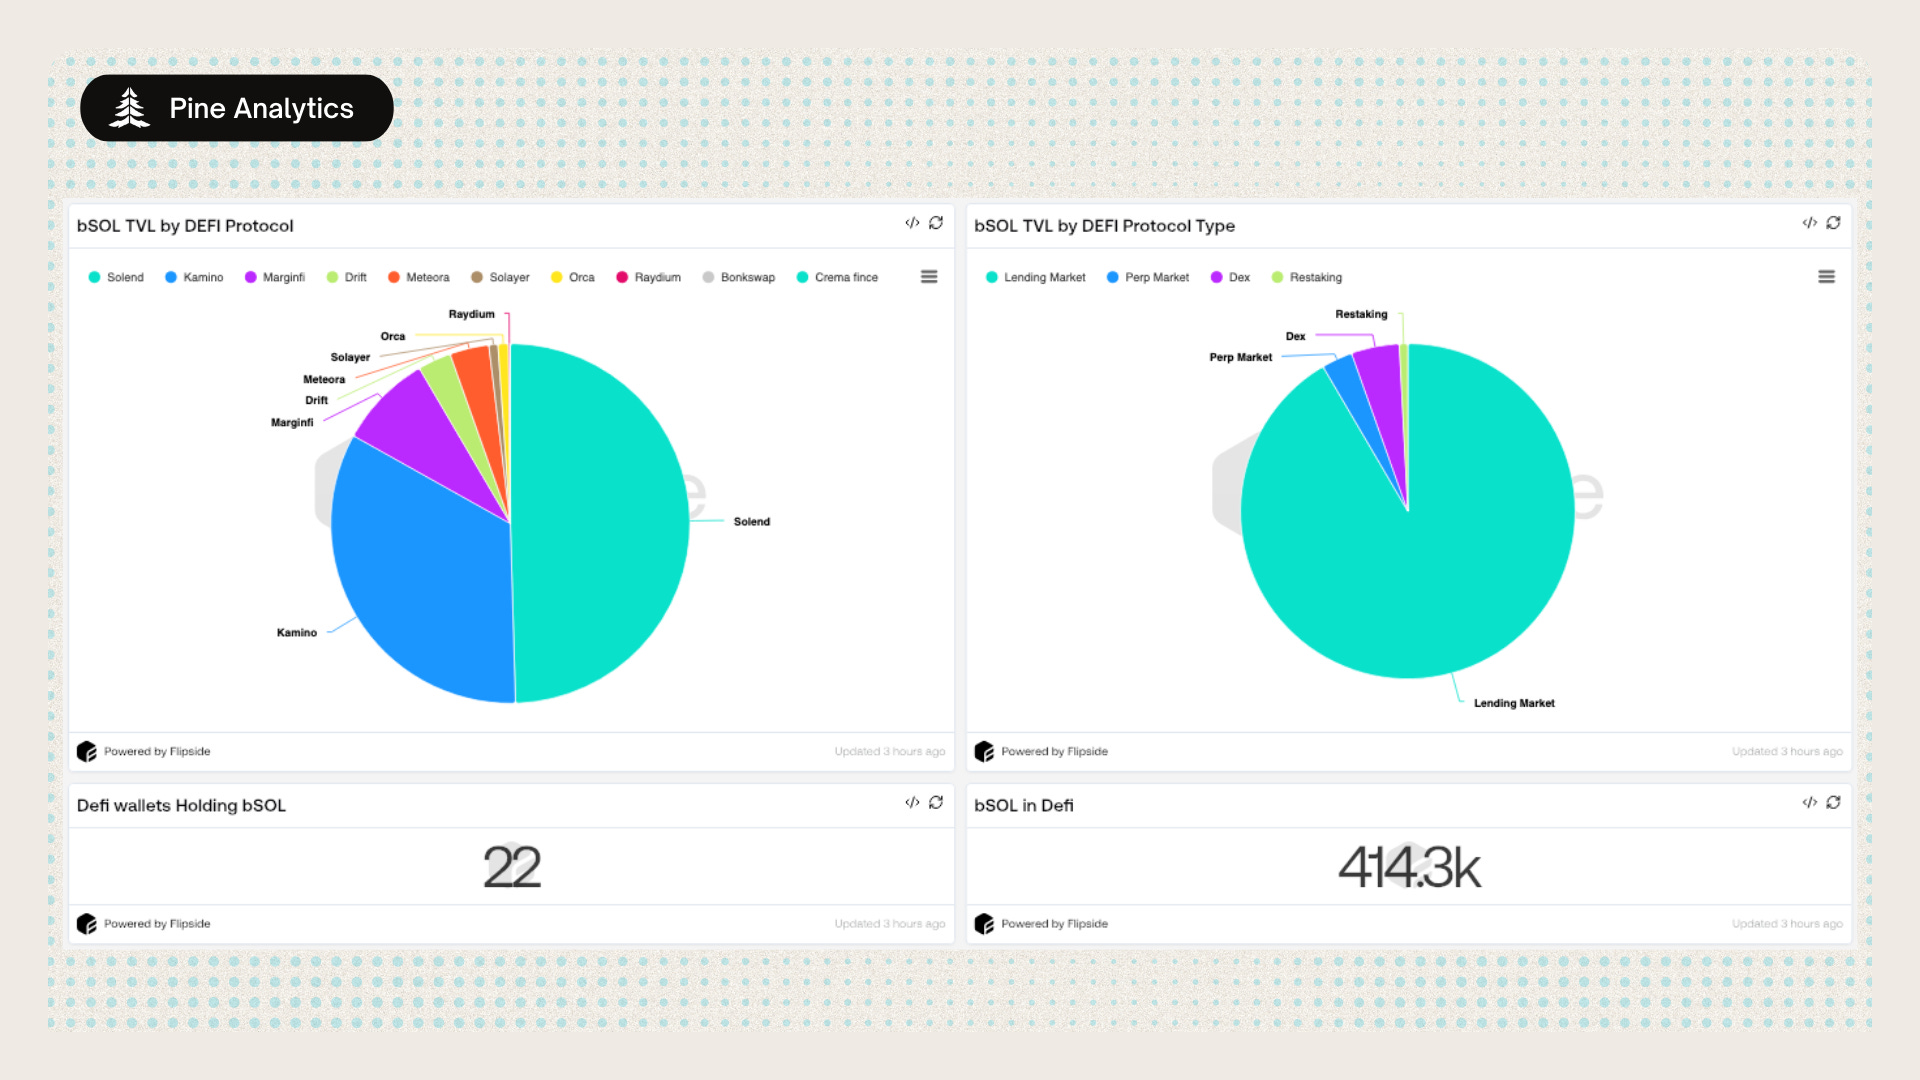
DeFi Integration Breakdown: Displays where bSOL is deployed across lending, DEX, perp markets, and restaking protocols.
DEX Activity: Monitors swap volumes, swappers, and active trading pairs over the past 7 and 30 days.
TVL by Protocol: Breaks down where bSOL is being used in DeFi by protocol and function, including Kamino, Solend, MarginFi, Drift, and others.
Yield Opportunities: Lists active bSOL pools, yield rates, TVL, and daily volume across DeFi platforms.
Together, these panels help users, protocols, and analysts understand how bSOL is circulating, being utilized, and accumulating value across the Solana ecosystem.

Wallet-Level bSOL Dashboard
https://flipsidecrypto.xyz/pine/bsol-wallet-activty-lookup-ltqdeQ
This dashboard allows individual users to explore their personal bSOL activity, including balance changes, and rewards earned. By inputting a wallet address, users can get a complete view of how their bSOL position has evolved over time.
Key Metrics Tracked:
bSOL Balance Over Time
View weekly changes to total and net wallet balances.SOL Rewards Earned from Holding bSOL
Track both weekly earnings and cumulative SOL yield from staking.Swap Activity
Detailed logs and visualizations of bSOL swap volume and frequency over time.Mint/Burn History
See if and when the wallet has minted or burned bSOL (if applicable).
This dashboard is especially useful for users who want to audit their staking yield, optimize their DeFi strategy, or verify reward flows for any Solana address holding bSOL.

Solana LST Ecosystem Activity Dashboard
https://flipsidecrypto.xyz/pine/canonical-lst-dashboard-81_UEO
This dashboard provides a comprehensive view into the current and historical activity across all Liquid Staking Tokens (LSTs) on Solana. It’s built for researchers, protocols, and ecosystem participants looking to track adoption trends, measure capital inflows, and compare performance across different LSTs.
Key Sections:
Daily TVL (SOL & USD): Tracks the total value locked in Solana LSTs over time, showing both the raw SOL deposits and their USD equivalents. Useful for monitoring inflows and market cycles.
LST Holder Growth: Displays weekly holder counts per token, allowing you to identify which LSTs are gaining or losing traction in user adoption.
LST Metrics Table: A sortable table that includes TVL, holder counts, and recent changes (1-week and 4-week deltas) across all major LSTs. Ideal for comparing relative growth.
TVL & Holder Change Charts: Bar charts showing the top LSTs by recent growth or decline in both capital and user base over 1-week and 4-week periods. Helpful for identifying momentum shifts or early signs of user churn.
This dashboard gives you an at-a-glance understanding of the health, trends, and competitive dynamics of the Solana LST landscape.
This dashboard allow a users to look up a wallets user hol,ding over time and SOL earnings and use of bSOL.